Current Practices
- The vast majority of corn acres in the U.S. and Canada are currently planted in 30-inch rows (Figure 1).
- This percentage has increased over recent years, from 80% in 2007 to nearly 86% in 2015.
- The percent of corn acres in wider row spacings (36- and 38-inch) has declined, comprising 7% of acres currently.
- Adoption of narrow row corn has been limited in most areas, with row spacings less than 30 inches used on about 6% of corn acres in the U.S. and Canada.

Figure 1. Corn row spacings (in inches) in North America as a percentage of total acres, 2015 (Pioneer Brand Concentration Survey).
- Regional implementation of narrow rows varies, with the highest frequency in Minnesota (where 22-inch rows associated with sugarbeet production are more common) followed by South Dakota (Figure 2).
- Narrow row implementation remains less than 5% in most of the central Corn Belt states.

Figure 2. Narrow row corn adoption (15-, 20-, and 22-inch) in the U.S. Corn Belt. (USDA-NASS farmer-reported row widths, 2013-2017.)

Row Spacing Research
- Over the years, research on narrow row corn has produced variable results, which suggests that multiple factors likely influence corn yield response to row spacing.
- Yield benefits with narrow row corn have been observed more frequently in the northern portion of the Corn Belt, north of approximately 43ºN latitude (line running roughly through Mason City, IA; Madison, WI; and Grand Rapids, MI).
- In a survey of several university studies comparing 15-, 20-, or 22-inch rows to 30-inch rows, the greatest yield benefits with narrow rows were observed in experiments conducted in Minnesota and Michigan (Figure 3).
- An average yield advantage of 2.8% with narrow or twin rows was observed in northern studies, compared to no advantage on average (-0.2%) for narrow rows in Iowa, Indiana, and Nebraska.

Figure 3. Average corn yield response to narrow rows in northern and central Corn Belt states observed in 20 years of university and Pioneer studies.
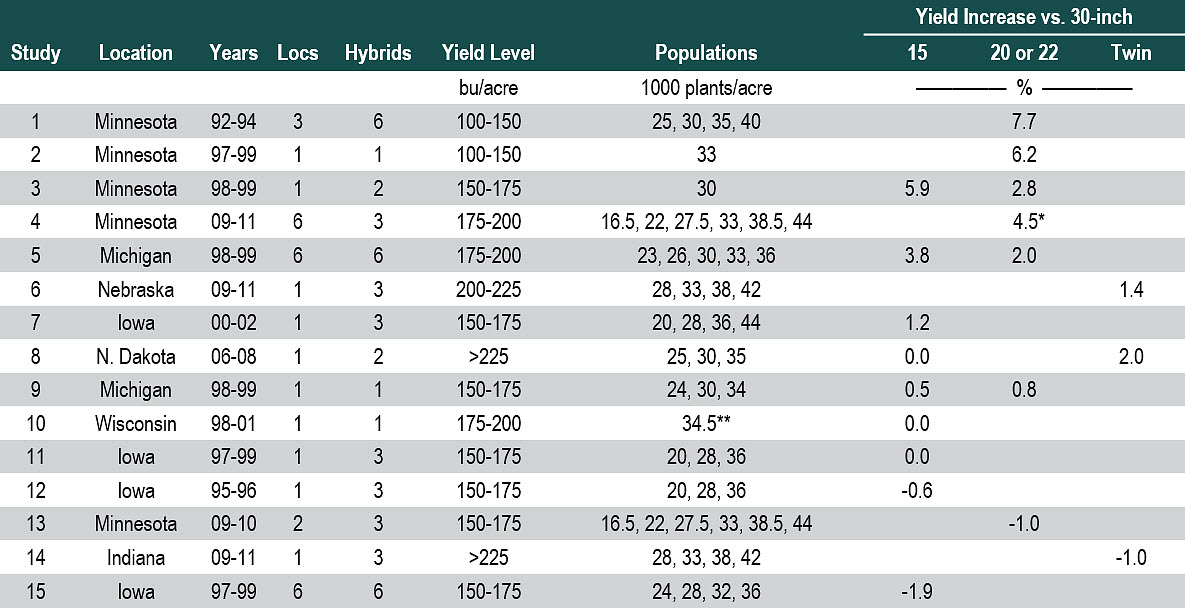
Table 1. Yield advantage (%) of 15-inch, 20-, or 22-inch, and twin rows compared to 30-inch rows in recent corn row spacing research studies.

1: Porter et al., 1997; 2: Johnson and Hoverstad, 2002; 3: Sharratt and McWilliams, 2005; 4: Coulter and Shanahan, 2012; 5: Widdecombe and Thelen, 2002; 6: Novacek et al., 2013; 7: Pecinovsky et al., 2002; 8: Albus et al., 2008; 9: Tharp and Kells, 2001; 10: Pedersen and Lauer, 2003; 11,12: Pecinovsky et al., 2002; 13: Van Roekel and Coulter, 2012; 14: Robles et al., 2012; 15: Farnham, 2001.
*Average yield increase at 38,500 and 44,000 plants/acre. A significant row spacing by population interaction was observed.
**Approximate final stand, which differed from target populations.
Click here or on the chart above for a larger view.
Rationale of Narrow Row Corn
- The primary rationale for narrow row spacings in corn is that by reducing the crowding of plants within a row, the crop will be able to better utilize available light, water, and nutrients by reducing competition among individual plants.
Light Interception
- Research has shown a strong relationship between improved yields in narrow row corn and increased light interception.
- Corn yield is largely driven by the amount of solar radiation intercepted by the crop during the critical period for yield determination, immediately before and after silking.
- In order to maximize yield, the crop canopy needs to capture 95% or more of photosynthetically active radiation (PAR) during this period.
- Several studies have shown that corn in 30-inch rows can routinely capture over 95% of PAR in central Corn Belt production.
- Increased light interception is generally thought to be the reason that yield increases with narrow rows tend to be more frequent in the northern Corn Belt.

Table 2. Light interception at V10 and R2 and yield of corn grown at 34,500 plants/acre in twin row, 30-inch and 15-inch rows in a University of Illinois study (Nafziger, 2006).

Water and Nutrient Recovery
- Narrow rows can improve nitrogen use efficiency of corn by increasing the ability of the crop to recover nitrogen from the soil; however, this advantage is reduced as nitrogen availability increases and may not result in increased yield when adequate nitrogen is available.
- Research has found that narrow rows increased water uptake during the early stages of crop growth. If water is not limited later in the season, the greater early uptake may be advantageous for the crop.
- However, research has not shown any broad advantage to narrow-row corn under drought stress conditions.
Author: Mark Jeschke
April 2018
The foregoing is provided for informational use only. Please contact your Pioneer sales professional for information and suggestions specific to your operation. Product performance is variable and depends on many factors such as moisture and heat stress, soil type, management practices and environmental stress as well as disease and pest pressures. Individual results may vary.
